 WeatherPower
SOUNDING API · FREE
Atmospheric soundings for any point in the US.
The same data behind WeatherPower Radar's point soundings: NOAA HRRR model profiles and the nearest real weather balloon, as clean JSON or a finished SounderPy chart.
- HRRRAnalysis + forecast hours F000–F018, 39 pressure levels, 3 km grid
- BalloonsNearest NWS radiosonde launch (00Z / 12Z), with skipped launches noted
- ImagesFull Skew-T + hodograph PNGs rendered with SounderPy
- CostFree for non-commercial use, with attribution
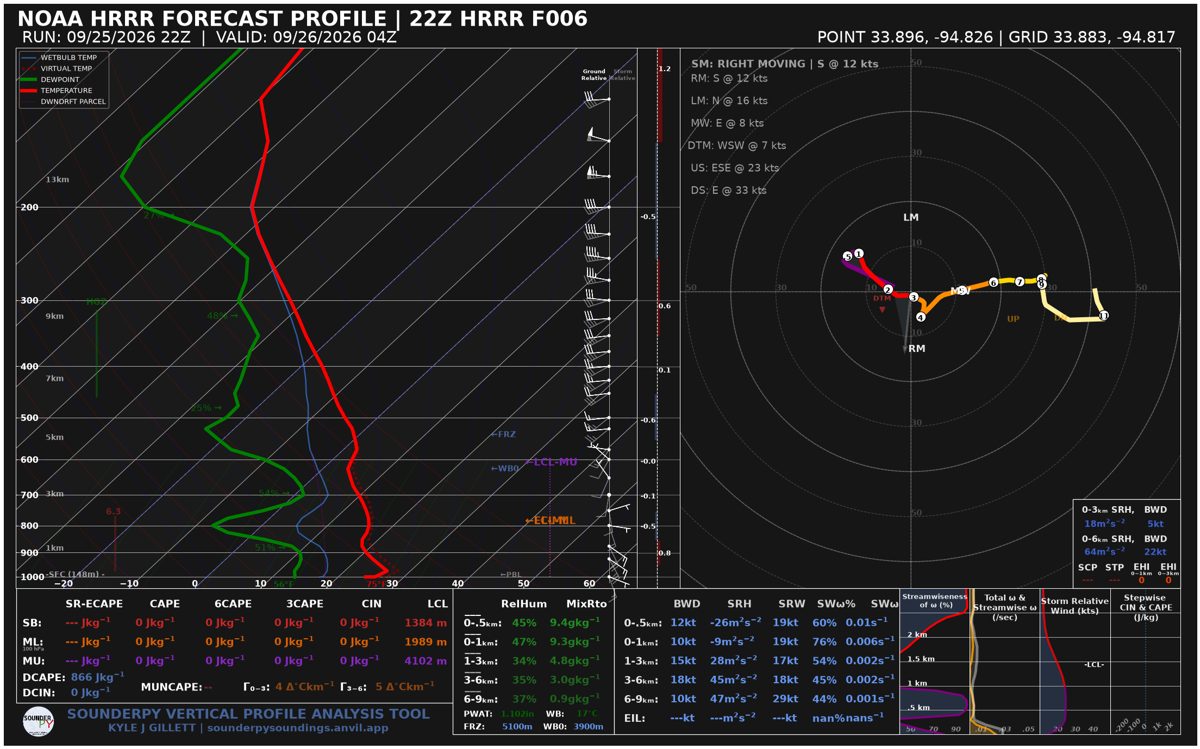
/v1/sounding.pngQuick start
Send your key in the X-API-Key header (or ?key=). Coordinates are decimal degrees.
curl -H "X-API-Key: wp_your_key" \
  "https://weatherpower.app/wpcc-api/v1/sounding?lat=35.22&lon=-97.44&hours=6"
curl -H "X-API-Key: wp_your_key" -o sounding.png \
  "https://weatherpower.app/wpcc-render/v1/sounding.png?lat=35.22&lon=-97.44&fhr=3"
const res = await fetch("https://weatherpower.app/wpcc-api/v1/sounding?lat=33.9&lon=-94.83", {
  headers: { "X-API-Key": "wp_your_key" },
});
const { observed, forecast } = await res.json();
// forecast.profiles[0].levels → [{ p, z, t, td, wd, ws }, …]  (hPa, m, °C, °, kt)
Endpoints
All responses are JSON unless noted. Errors look like {"error": "…"} with a matching HTTP status.
Base URLs: https://weatherpower.app/wpcc-api for JSON/account endpoints · https://weatherpower.app/wpcc-render for rendered sounding images.
| Path | Parameters | Returns | |
|---|---|---|---|
| GET | https://weatherpower.app/wpcc-api/v1/sounding | lat, lon, model hrrr|gfs, hours 1–48 (hrrr) / 1–120 (gfs), include observed,forecast | observed: nearest balloon (station, distance, levels, derived). forecast: hourly model profiles with model CAPE/CIN/LI and derived indices. |
| GET | https://weatherpower.app/wpcc-render/v1/sounding.png | lat, lon, fhr 0–18 | image/png SounderPy chart. Headers X-HRRR-Run, X-HRRR-Valid, X-Grid-Lat, X-Grid-Lon. First render of a new hour can take ~15 s. |
| GET | https://weatherpower.app/wpcc-api/v1/limits | — | Current per-key limits. No key needed. |
Levels are ordered surface-first. Units: pressure hPa, height m above sea level, temperature/dewpoint °C, wind direction °, speed kt.
Derived values (precipitable water, 700–500 lapse rate, freezing level, 0–6 km shear, LCL, surface CAPE/CIN) are computed by WeatherPower from each profile. CAPE/CIN there are approximate; the HRRR model's own CAPE/CIN/LI are included separately.
Coverage. HRRR covers the contiguous US. Balloon soundings come from active sites within 900 km. Points with no data return available: false and a reason instead of a guess.
Freshness. HRRR analyses appear ~1.5–2 h after each hourly run; forecasts use the newest run that has the requested hour.
Limits
Per key. Up to 3 keys per account. Days reset at 00:00 UTC.
| Kind | Per minute | Per day |
|---|---|---|
| JSON data | 60 | 5,000 |
| PNG images | 10 | 500 |
Terms & attribution
Free for non-commercial use. Please credit the data where you show it:
“Soundings: NOAA HRRR & NWS radiosondes via WeatherPower. Forecast profiles by Open-Meteo (CC BY 4.0). Balloon data via Iowa Environmental Mesonet. Charts by SounderPy.”
Not for life-safety decisions. Data can be late or missing; we return what the sources publish and never fill gaps with made-up values.
Your API key
Create an account with your email, verify it, then generate a key. Keys are shown once — store them somewhere safe.
We sent a verification link to your email. Open it, then come back here.
| Name | Key | Created | Today | |
|---|---|---|---|---|
| No keys yet. | ||||